As a mobile marketer, push notifications are a crucial channel to connect with and retain your app users. They provide a direct and immediate line of communication for announcing new content, updates, promotions, and events within the app.
But gauging the success of your campaigns can be challenging. Does a low open rate mean your users aren’t engaged? Not necessarily.
To accurately measure the performance of your push campaigns, you need to understand what success means for your app and track the right metrics that will give you that data.
Here are the top push notification metrics you should know about and how to interpret them to optimize your strategy and maximize campaign performance.
Open rate
The open rate measures the number of users who click on a push notification as a percentage of the total notifications delivered successfully.
Open Rate = Number of Clicks/Number of Delivered Notifications x 100
This metric provides insight into how effective your notifications are at grabbing attention and driving users back to your app. It’s important to note that a low open rate doesn’t necessarily mean your users don’t find the content engaging. What success looks like for your campaign depends on the type of message you’re sending.
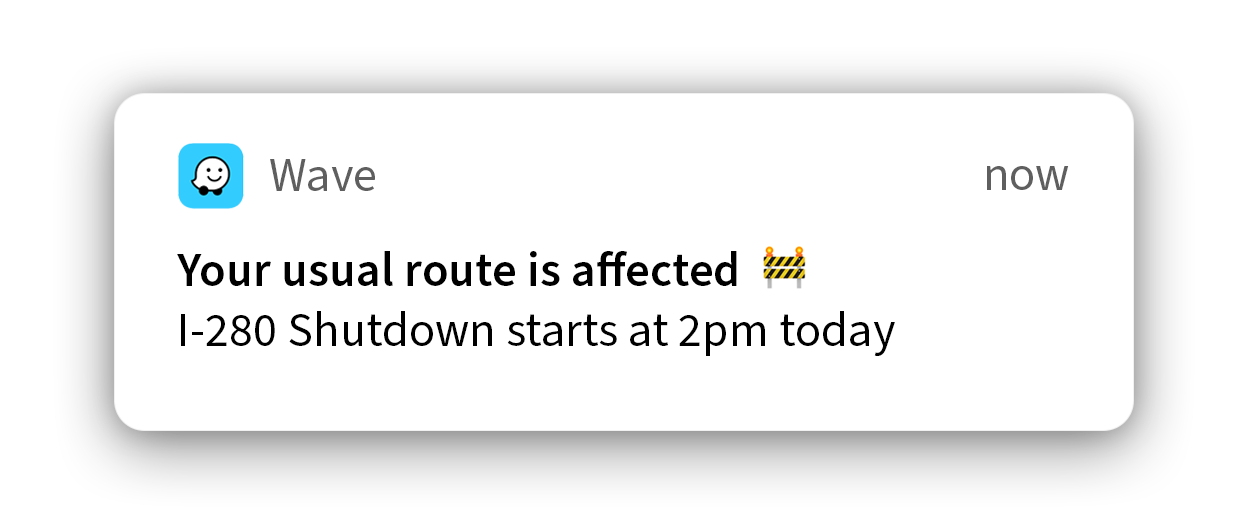
Take this example from Waze. The navigation app sent this notification to users who regularly take the I-280 freeway. Unless users need to find an alternative route, there is no need to open the notification.
Of course, strong open rates suggest positive engagement, but combining metrics will give a clearer view of performance. Analyzing opens with conversions, delivery rates, active users, opt-outs, and uninstalls can provide a more holistic view of how your push efforts are influencing engagement and retention.
Conversion rate
Measure the conversion rate of your campaigns to determine how successful your push notifications are at driving users to complete a desired action. A conversion can be anything from making a purchase, completing a task, using a feature, or visiting a specific section of the app.
Conversion Rate = Number of Users Who Completed the Desired Action/Number of Users Who Received the Notification x 100
If your conversion rate is high, the offer in your notification and the path to obtaining it is clear, interesting, and effective. Low conversion rates could be due to a number of factors, such as irrelevant content, inappropriate timing, an unclear call-to-action, or a poor user experience.
A/B test the different elements of your campaign journey to determine what is and isn’t driving conversions in your app. When you understand what resonates with your users, you can make data-driven decisions to optimize and scale your push strategy.
Opt-in rate
The opt-in rate refers to the percentage of users who have agreed to receive push notifications from the app. This metric can bring to light the preferences and behavior of different user segments and how they wish to engage with your app.
To calculate, divide the number of users who have consented by the total number of app users.
Opt-In Rate = Number of Opted-In Users/Number of Users x 100
A high opt-in rate suggests users are getting value from your notifications and is a good indication they find the content, timing, and frequency of your messaging relevant to their needs.
A low opt-in rate, on the other hand, could indicate a disconnect between the intention of your campaigns and what the user needs, expects, or finds useful.
Time spent in the app
Tracking the time a user spends in your app as a result of receiving a push notification can indicate how aligned your messaging is with users’ preferences and expectations.
There are other instances where a user reads and dismisses the push message but later revisits your app as a direct result of receiving the recent notification. Depending on the app or campaign, you can set these influenced app sessions on a customizable attribution window, such as 30 minutes, an hour, or 24 hours after receiving a push.
For example, a user receiving this push message might initially dismiss the notification but later return to the app to make a purchase before the deal expires.

Analyzing the performance of your push notifications
Mobile-first brands across the globe are using push notifications to power their app engagement strategy. But to maximize return, marketers need to analyze campaign performance in meaningful ways.
Whether you’ve been leveraging this key channel for years or are just beginning, knowing what success looks like is critical to long-term engagement and retention.
Now that you know the key metrics you need to track, it’s time to elevate your strategy. We’re here to help you get the best results from your push campaigns using a data-driven, personalized approach.
Learn more:
- How to Increase Your Push Notification Opt-In Rates
- Best Ways to Reduce Your Mobile App Churn Rate
- How to Engage First-Time Mobile App Users & Keep Them Coming Back for More

Sarah Kelly
Sarah is a passionate marketing professional devoted to crafting thought-provoking content that fuels business growth and success. With over a decade of experience in the ever-evolving marketing world, she brings a strategic and data-driven mindset to her role as SEO.