
In-app messaging is a crucial component of a strong mobile engagement strategy – one that reaches users at the right time, in the right place, and is consistent across the customer lifecycle. This article delves into the various types of in-app messages mobile marketers can build and personalize to foster deep, lasting engagement throughout the user journey.
What is in-app messaging?
While push notifications appear on the user’s home screen even when the app is closed, in-app messages are displayed only when the app is open and the user is actively engaged. The beauty about this channel is you don’t require consent from users, unlike push, where users must explicitly opt-in to receive notifications.
In-app messages play a key role in enhancing engagement and have the power to positively influence retention at every touchpoint. Crafting messages with precision is essential as they serve to streamline the app experience and guide users on how to gain value from the app.
In-app messaging examples and use cases
Here are the top use cases for in-app messaging campaigns that every app marketer should know about:
Onboard new users
Onboarding marks a new user’s initial interaction with your app, and getting this experience right can boost retention rates by up to 50%. A successful onboarding process should quickly showcase your app’s value and help users understand its core features and functionality. Create a seamless multi-screen flow to welcome new users and present your app’s value proposition. Go a step further and customize each screen to take your users on a dynamic step-by-step onboarding journey that matches the look and feel of your app.
Waze onboarding flow
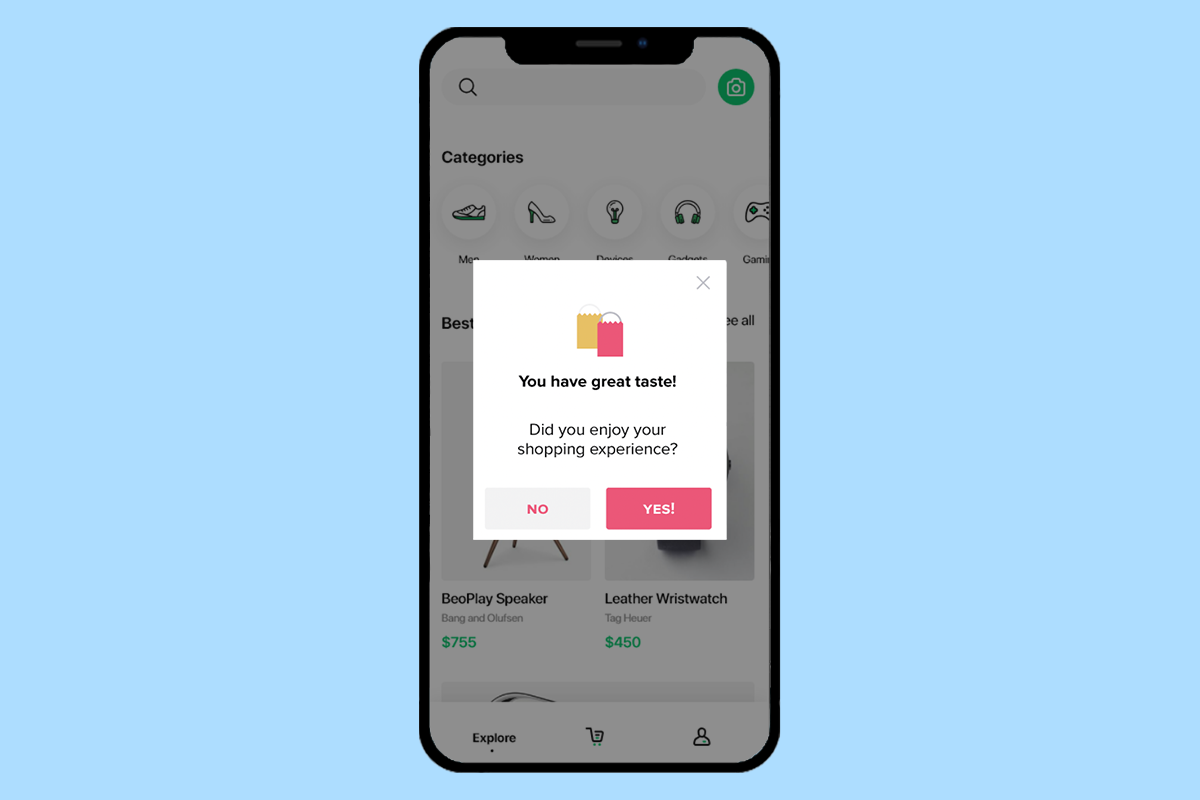
Prompt feedback and reviews
App store ratings and reviews can significantly influence the success of an app, with 99% of the top 100 grossing apps boasting ratings of 4 stars or higher. When trying to garner positive feedback, how and who you ask matters. Using in-app messages, you can pre-prompt users to gauge their satisfaction levels before officially requesting a review on the app store.
Segmenting your audience ensures those receiving prompts are not only likely to respond but also to respond positively. Typically, active and engaged users are more inclined to rate their experience positively. For example, send your campaign to users who have placed at least five orders or spend a minimum of ten minutes in each app session. This approach maximizes your chances of receiving positive responses by targeting users who demonstrate a strong level of interaction and satisfaction with the app.
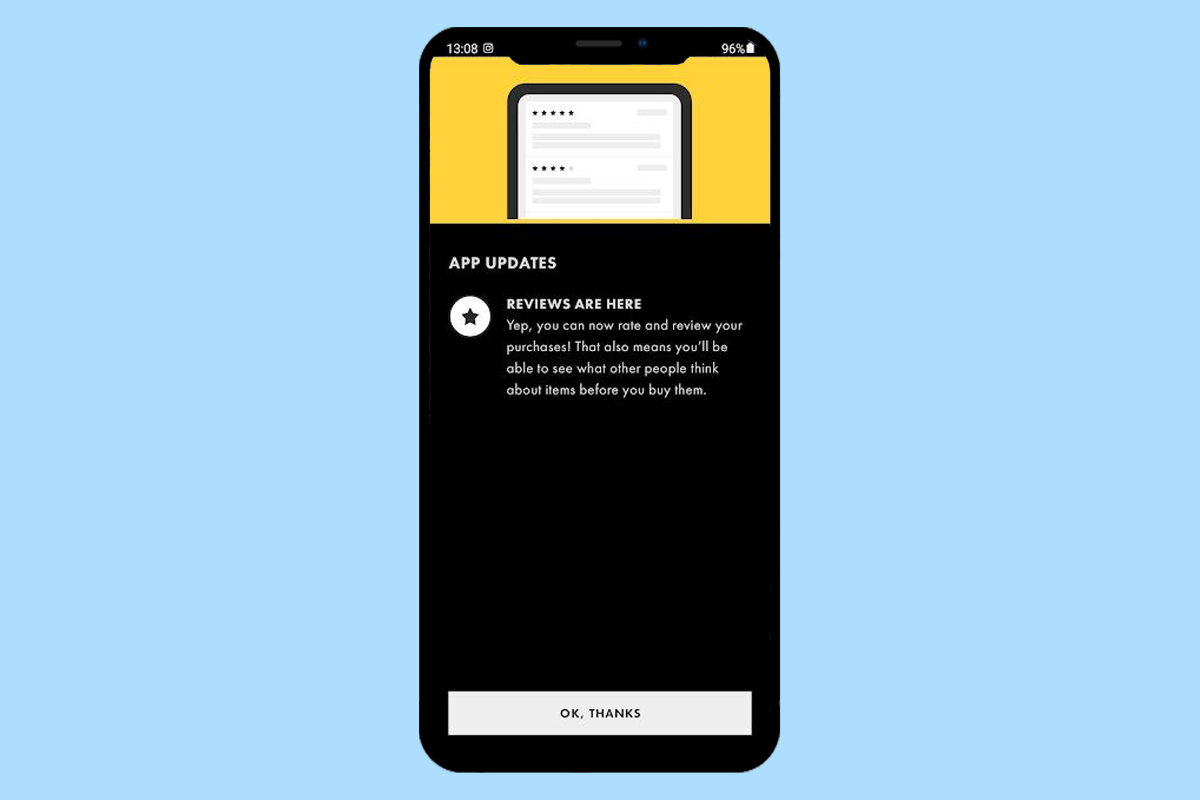
Help users discover new features
In a feature-rich app, it’s easy for users to overlook certain elements that could help them achieve their goals and enhance their app experience. Leverage in-app messages to unveil new or underused features at the exact moments a user would likely need them and understand their value. This targeted approach sees much higher engagement and feature adoption rates than other methods, such as announcing the feature in a push notification or when the user launches the app.
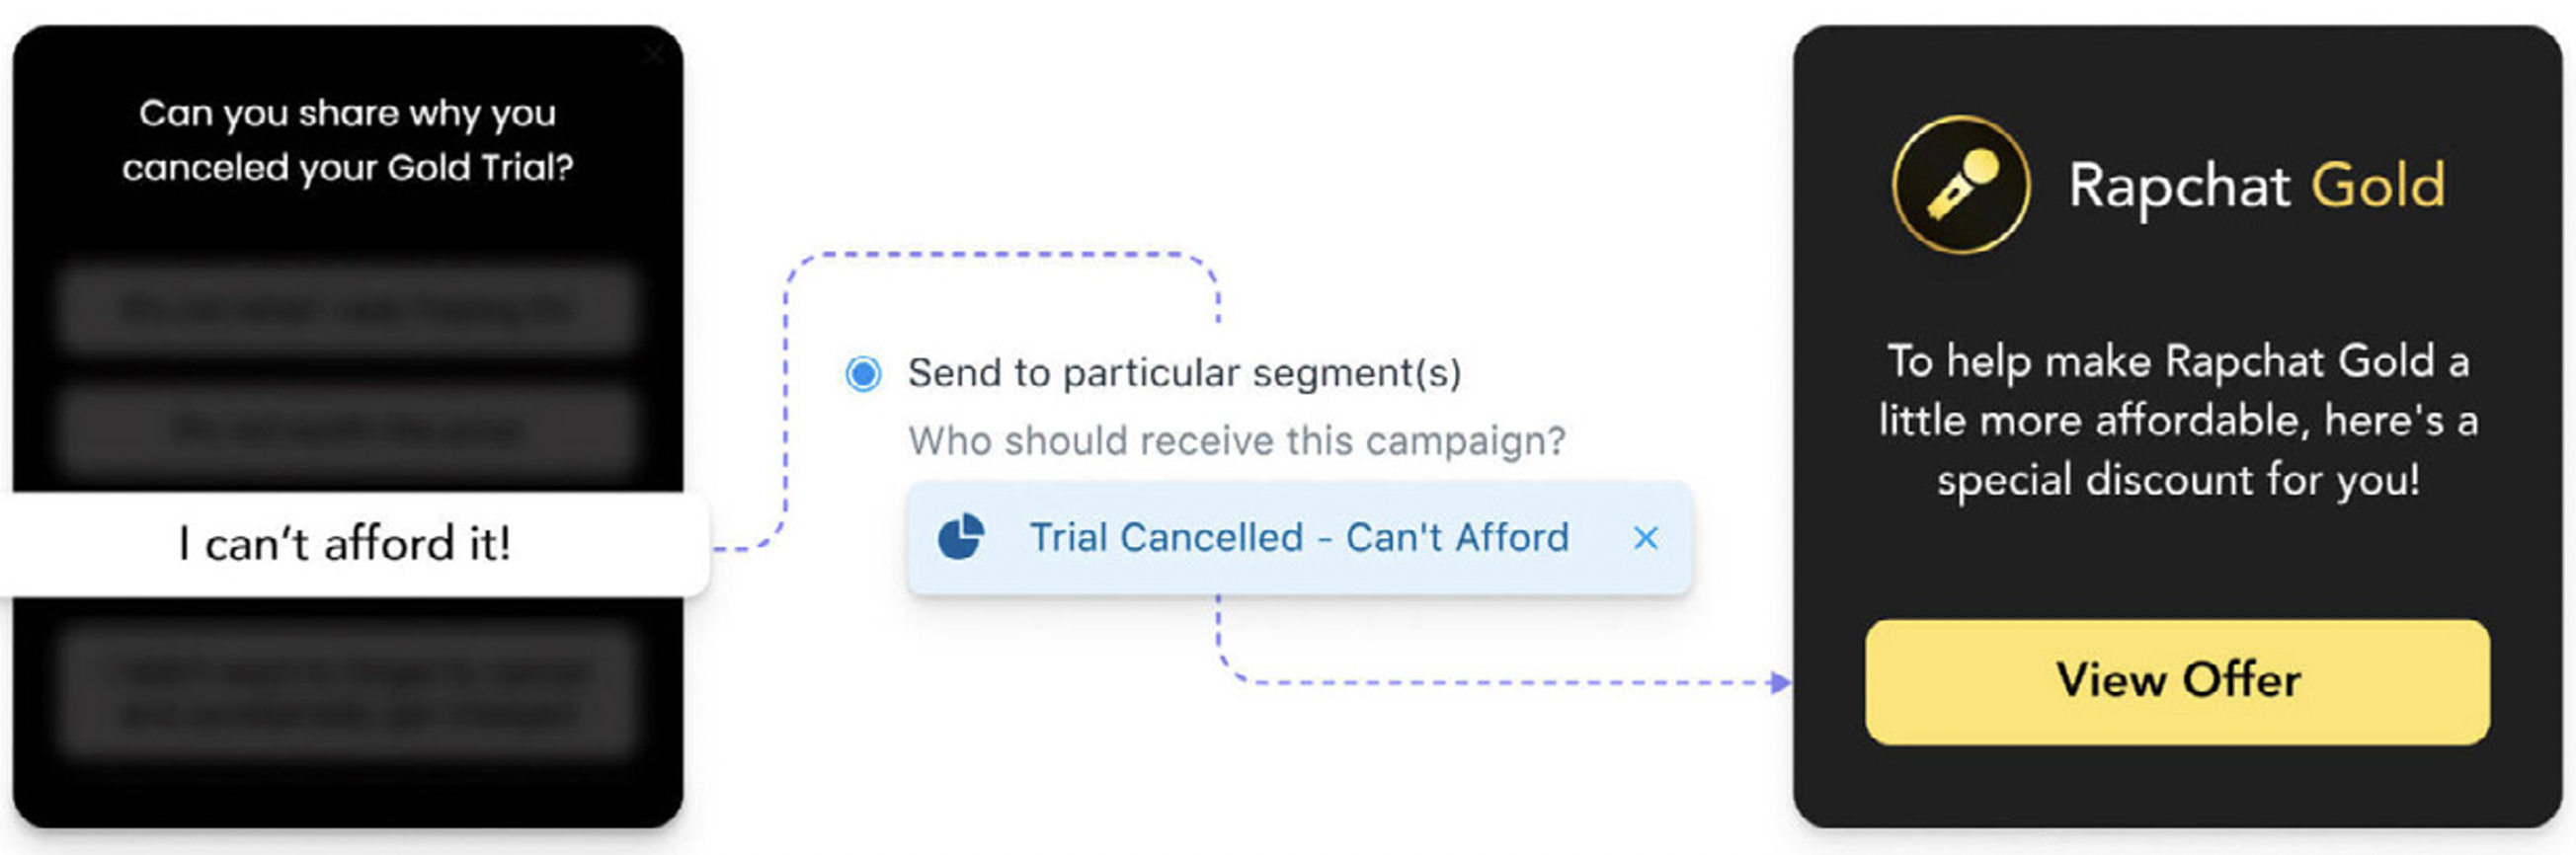
Retain users at risk of churning
Pay special attention to users who are becoming less active on your app, particularly those who have not opted in to receive email or push notifications. In-app messaging may be your only communication channel to prevent these users from churning. When an at-risk user opens your app, how do you convince them to stay engaged and keep returning? For a retail app, this could be a time-sensitive promotion for free shipping on their next order or a gaming app could gift the user with free tokens to encourage gameplay.
If a user reaches the end of a free trial, launch an in-app survey to establish why they chose not to continue. Then use this feedback to segment users based on why they canceled and trigger an appropriate subscription discount.
Encourage social sharing and advocacy
Transform your active app users into brand ambassadors by prompting them to share your app or its content across their social channels.

Encourage continued user engagement by offering referral rewards such as cashback, account credit, and discounts when users invite their networks to sign up for your app.
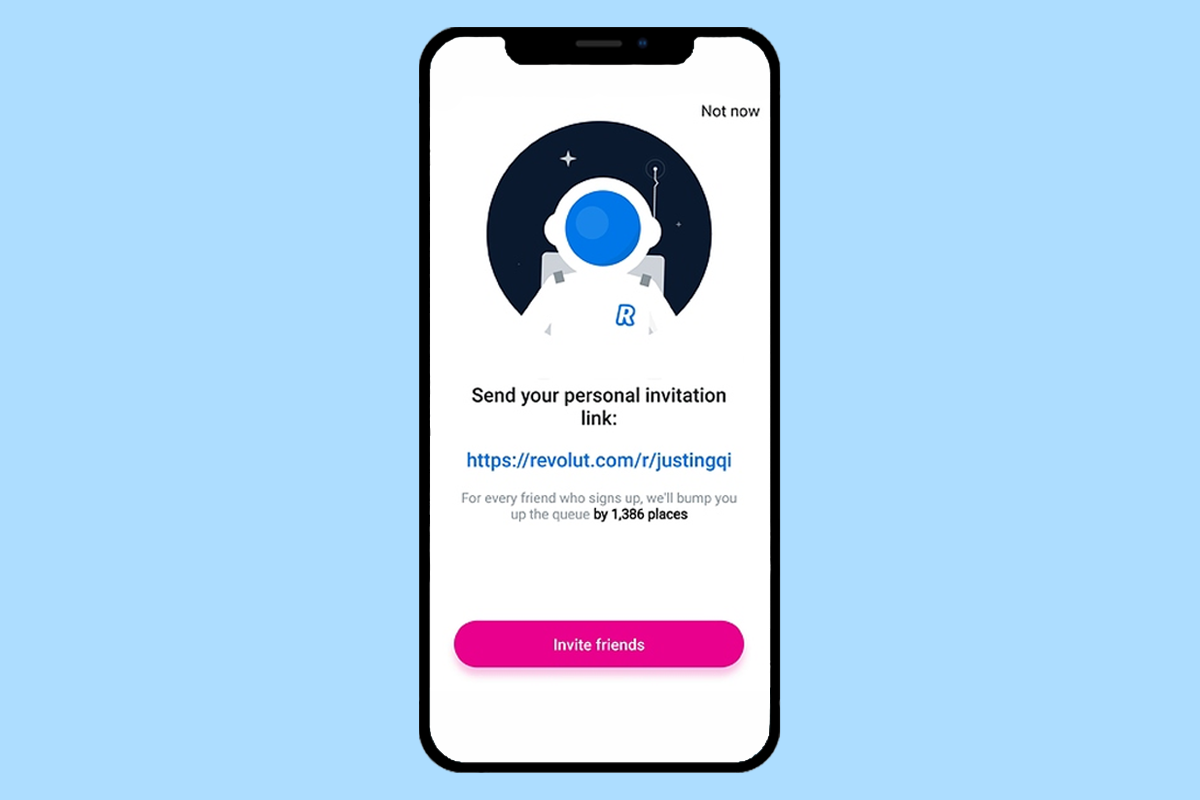
Revolut referral program
Upsell subscriptions
Subscription-based apps are increasingly common across all industries. Most of these apps are free to download and usually offer users either a freemium product or a time-boxed free trial. But the ultimate goal is to convert these users into paying customers. To achieve this goal, marketers can use in-app messaging to prompt users for their payment information before their free trial ends. Time this campaign to coincide with moments when users are most likely to see the benefits of upgrading to a premium plan. This strategic approach maximizes the chances of converting free trial users into paying subscribers.
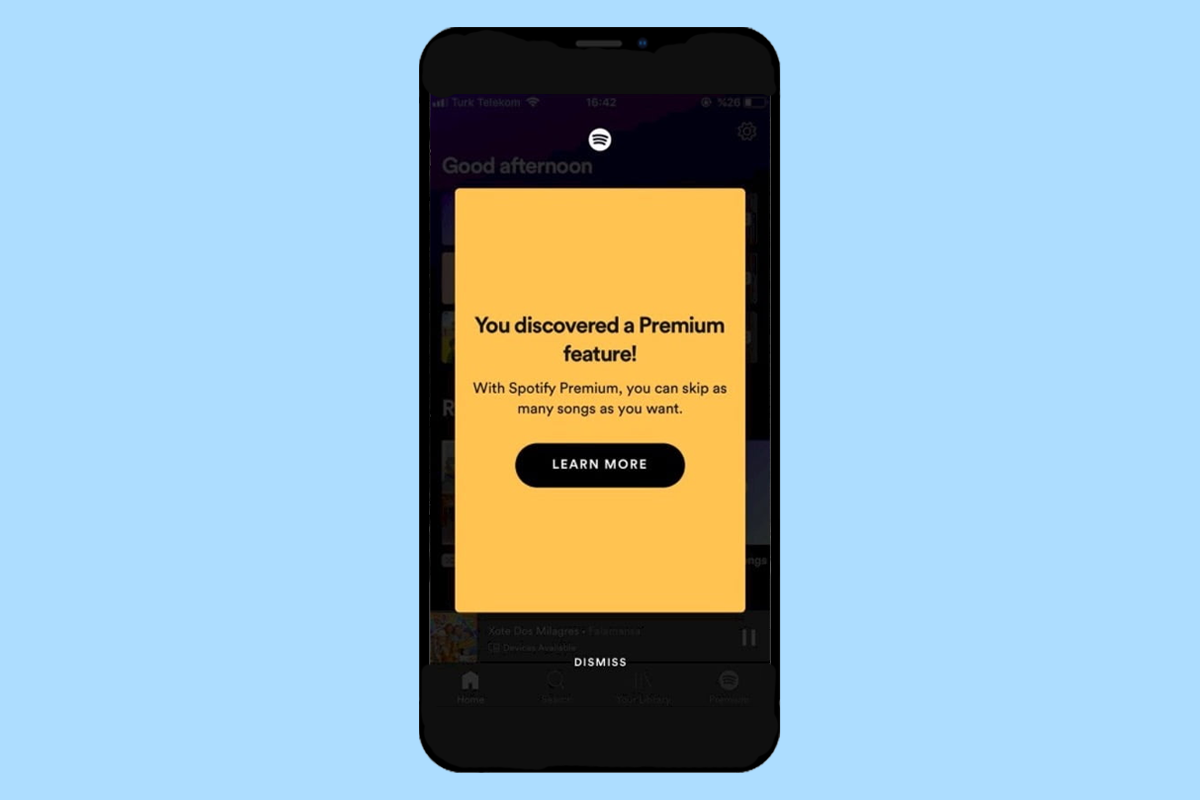
Spotify upgrade prompt
Spotify does this exceptionally well. The music streaming service allows freemium users to skip six songs per hour. When they exceed this limit, users are prompted with an in-app message to upgrade to a premium account. Spotify presents the notification when it knows the user wants access to a feature only available on the premium version. But rather than the user feeling hindered, Spotify’s messaging creates an opportunity – “You discovered a Premium feature. Upgrading to Spotify Premium will unlock it”.
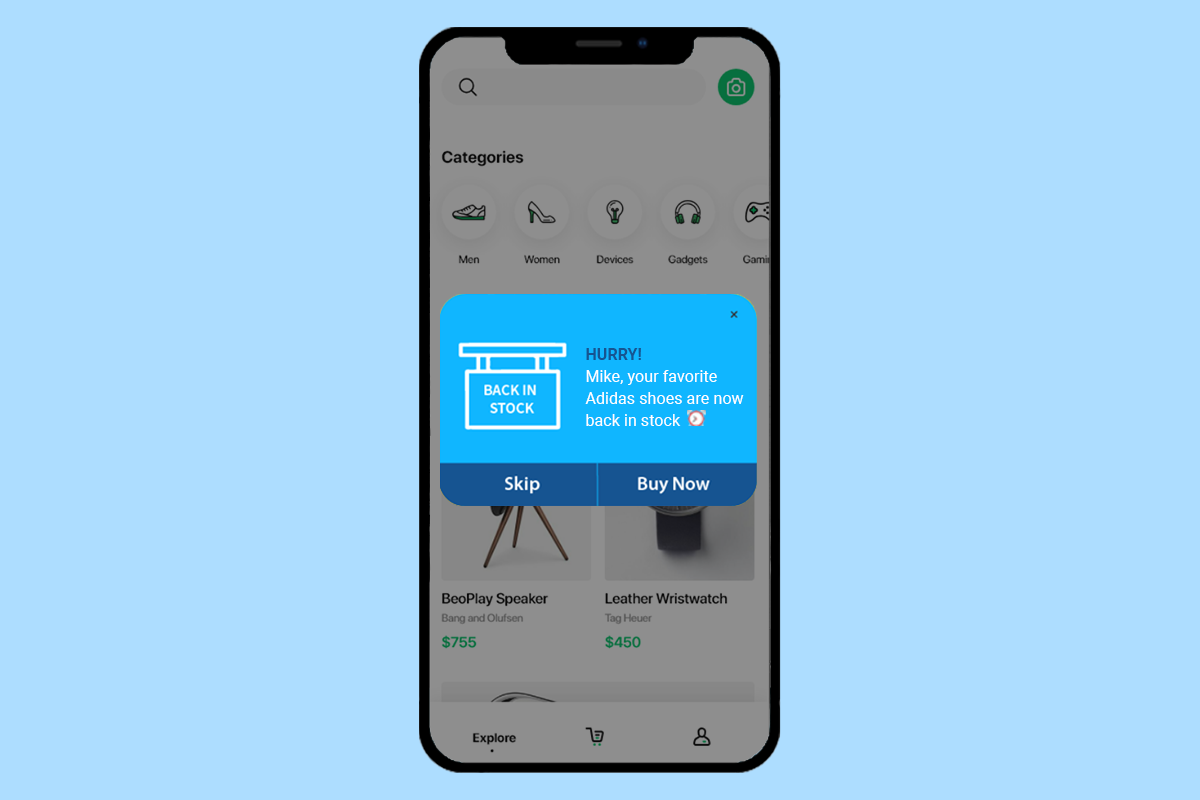
Deliver personalized updates
Use a customer’s purchase and browsing history to deliver relevant product recommendations, stock updates, and new product releases at appropriate times while they are consuming your app.
Share important announcements
Send alerts about important updates and announcements as they happen while users are active in your app. The navigation app Waze provides helpful updates to its users throughout their journey, such as traffic information, road incidents, and faster available routes.

Waze traffic alert
Convince users to opt-in
Getting consent for user permissions like push notifications, location, camera, and email communications can be tricky. One of the biggest mistakes apps make is requesting all user permissions during the first app launch before the user fully understands the value of opting in.
Maximize your opt-in rate by using in-app messages to request permissions within the context of your user’s real-time behavior. Analyze users’ in-app activity to identify the perfect moments to trigger your requests. For example, a news app could set an activating event after a user has read a certain number of articles, asking if they would like to receive updates related to the topics they have been reading.

In-app messaging with MessageGears
If you want to take a closer look at our powerful messaging platform, schedule a demo with a MessageGears customer engagement expert.
Interested in reading more about in-app messaging? Check out some of our other resources:

Sarah Kelly
Sarah is a passionate marketing professional devoted to crafting thought-provoking content that fuels business growth and success. With over a decade of experience in the ever-evolving marketing world, she brings a strategic and data-driven mindset to her role as SEO.