
The American psychiatrist Milton Ericsson once said, “The effectiveness of communication is not defined by the communication, but by the response.” While he may not have been talking about mobile push notifications, his philosophy is undoubtedly apt—or is it?
The Evolution of Push
In 2003, Blackberry launched the first version of the push notification when it began informing users when they had received an email. They called it Push Services, and it was the first-ever email notification system. Push updated users the moment they received an email on their device. The notifications appeared as a small tab of information on the mobile screen. This feature ensured RIM’s Blackberry was the chosen business device for years. What we now take for granted was revolutionary at the time as users would now receive emails instantly rather than having to visit their inbox to check for new mail. The connected mobile experience was officially established.
Over time the push notification has grown in both sophistication and ubiquity.
In June 2009, Apple introduced its iPhone update iOS 3.0, which gave its customers a new user experience. It was Apple’s version of push notifications, and they called it APNS—Apple Push Notification Service. Users received alerts much like Blackberry’s from Apple, as well as from an ecosystem of utilities called ‘apps’. Apple’s update brought the push notification out of the email space and into a new era of multi-channel messaging.
Blackberry gave us a revolutionary technology, Apple took it mainstream, and Google quickly adopted it when it too entered smartphone territory. Push, in time, became the default way to interact with the entire mobile space. It became the stimuli for users to open an app, read an article, communicate with friends, engage with a game, and so much more. Pretty soon, we knew no other way of mobile interaction.
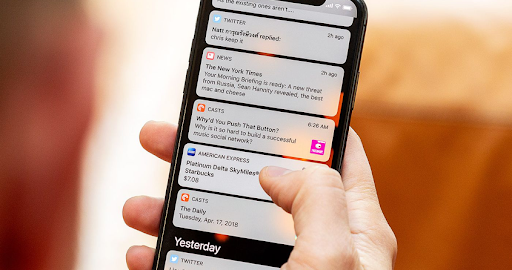
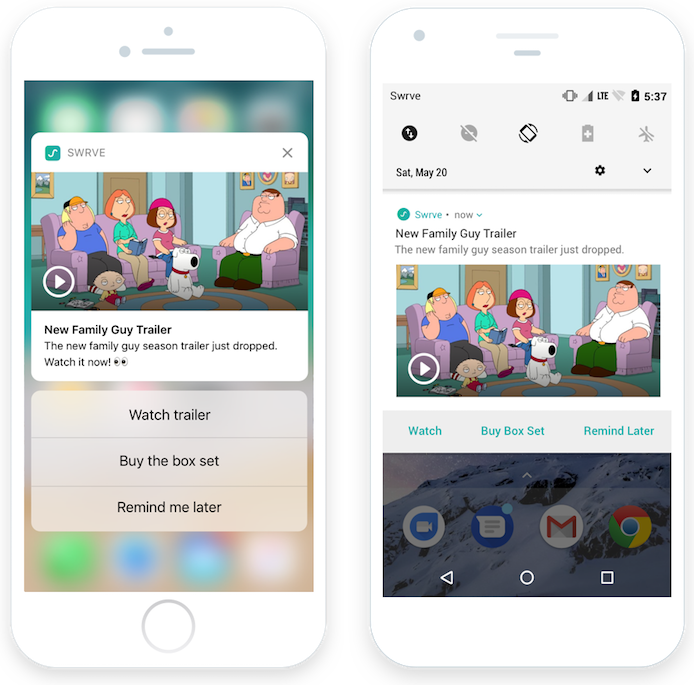
Fast-forward to 2022, and the modern-day push notification includes media, action buttons, and caters to the individual. It is used to convey information and updates, encourage users to engage with an app, send reminders, and serve as a step in the user journey.
In the battleground of engagement, push notifications play a pivotal role. As notifications evolve, app marketers and developers must evolve alongside them to effectively communicate and engage with customers. That means continuously analyzing how users react to your messaging to ensure you consistently provide value when users want it most.
But, how do you know if you are adding value or not? How is engagement measured? And, what if users fail to react to your push messaging?
Understanding the Metrics
It’s easy to misinterpret the metrics surrounding push notifications. Open rate, click-through rate, engagement rate—what’s the difference? It depends on who you ask. After much industry analysis, it seems everyone has a different perception of what each of these metrics means. But once you can define what it means for your app, you can accurately measure and interpret the data.
Here at Swrve, and for the purpose of this discussion, we define all three metrics as essentially meaning the same thing. To elaborate, if your push notification includes a deep link to an area within your app, the user will automatically arrive at this destination upon tapping the message. Hence, the open rate is the click-through rate. This is very different from email, whereby an open takes the user directly to the email content, and they can then click (or not click) on one or more URLs within the email itself.
So, any one of these three metrics can be defined as the percentage of total push sends that are tapped, resulting in an app open. Depending on several factors that we will discuss below, this metric can be key to measuring the success of your push notification strategy.
2021 Industry Stats
In 2021, the average open rate for push notifications was 4.6% on Android and 3.4% on iOS. Android maintains a wide lead over iOS due to differences in how notifications behave on each device. When you unlock an Android device, notifications remain on the screen, requiring users to swipe to dismiss them. On iOS, the notification disappears when you unlock the device and is grouped with the app’s other messages in the notification center.
Open Rate by Vertical
Push open rates vary widely across industry and operating system. Overall, the best performing verticals for Android include education, travel, utilities, finance, and social, with average open rates of ~10% and high values reaching 25%-30%. For iOS, education, fitness, and utilities boast the highest open rates with an average of ~5.5% and the highest reaching 12%-18%.
In contrast, entertainment, media, sports, and gaming tend to experience lower open rates across Android and iOS, with an average of ~2.5%.
Apps used regularly tend to experience higher engagement rates. They use notifications that naturally complement what has become part of a user’s regular routine. The notification becomes a core part of the product experience. Utility, finance and ride-sharing apps are prime examples. When a user displays predictive behavior, an app can get to know a user’s daily routines, and accurately send timely and relevant messages e.g. daily commutes, regular spending, workout routines, etc.
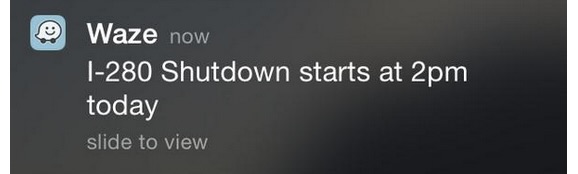
Take this example from Waze. The navigation app sent this push notification to users who regularly take the 280 freeway from San Francisco to Silicon Valley. Here you probably have 'glance as engagement'. All the information is presented, and unless users need to find an alternative route, there may be no need to open the notification.
Improving the Open Rate
Running highly targeted push notification campaigns to specific user segments can earn a 21% higher open rate than messages sent without the use of segmentation criteria, with open rates reaching 30%. Personalization can increase open rates by up to four times.
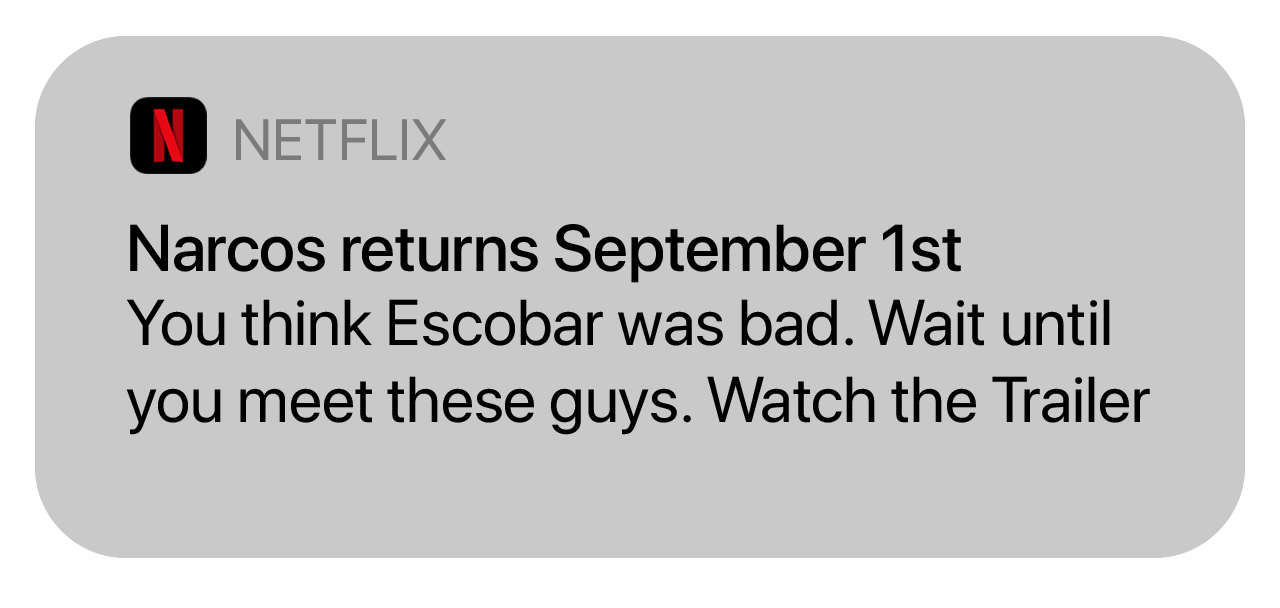
Netflix is an expert when it comes to personalized communications. Each user receives unique messages about the shows they have been watching. Rather than sending every user a notification every time a new episode of any show is released, consider this perfectly personalized notification:
The use of emojis and optimizing send times can improve open rates by 20% and 40%, respectively.
Incorporating rich media elements such as images, gifs, and video into your messages can gain up to a 60% higher open rate than those without such features.
Data shows that A/B testing message elements such as text, images, icons, badges, and calls-to-action can lead to an 8% improvement in open rates.
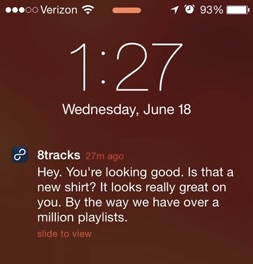
8tracks used humor as part of their push notification strategy reducing churn by 8% and increasing user engagement by 23%.
Optimal Times to Send Push Notifications
A combined-industry analysis confirms a peak in opens from Sunday to Tuesday. The highest reaction rates occur on Tuesday (8.4%), followed closely by Sunday (8.1%). However, there isn’t a great deal of variation between days. There is only one percentage point between the highest and lowest day which suggests we should be careful when drawing conclusions from this data.
When we analyze the times of the day, there is a daytime peak in activity at lunchtime and again late in the evening when we would expect users to be winding down for bedtime. Understandably, there is a dip in open rates during work and commuting hours.
Using machine learning, Swrve can optimize delivery by determining the exact time a user is most likely to engage with a push notification from your brand.
Interpreting The Metrics
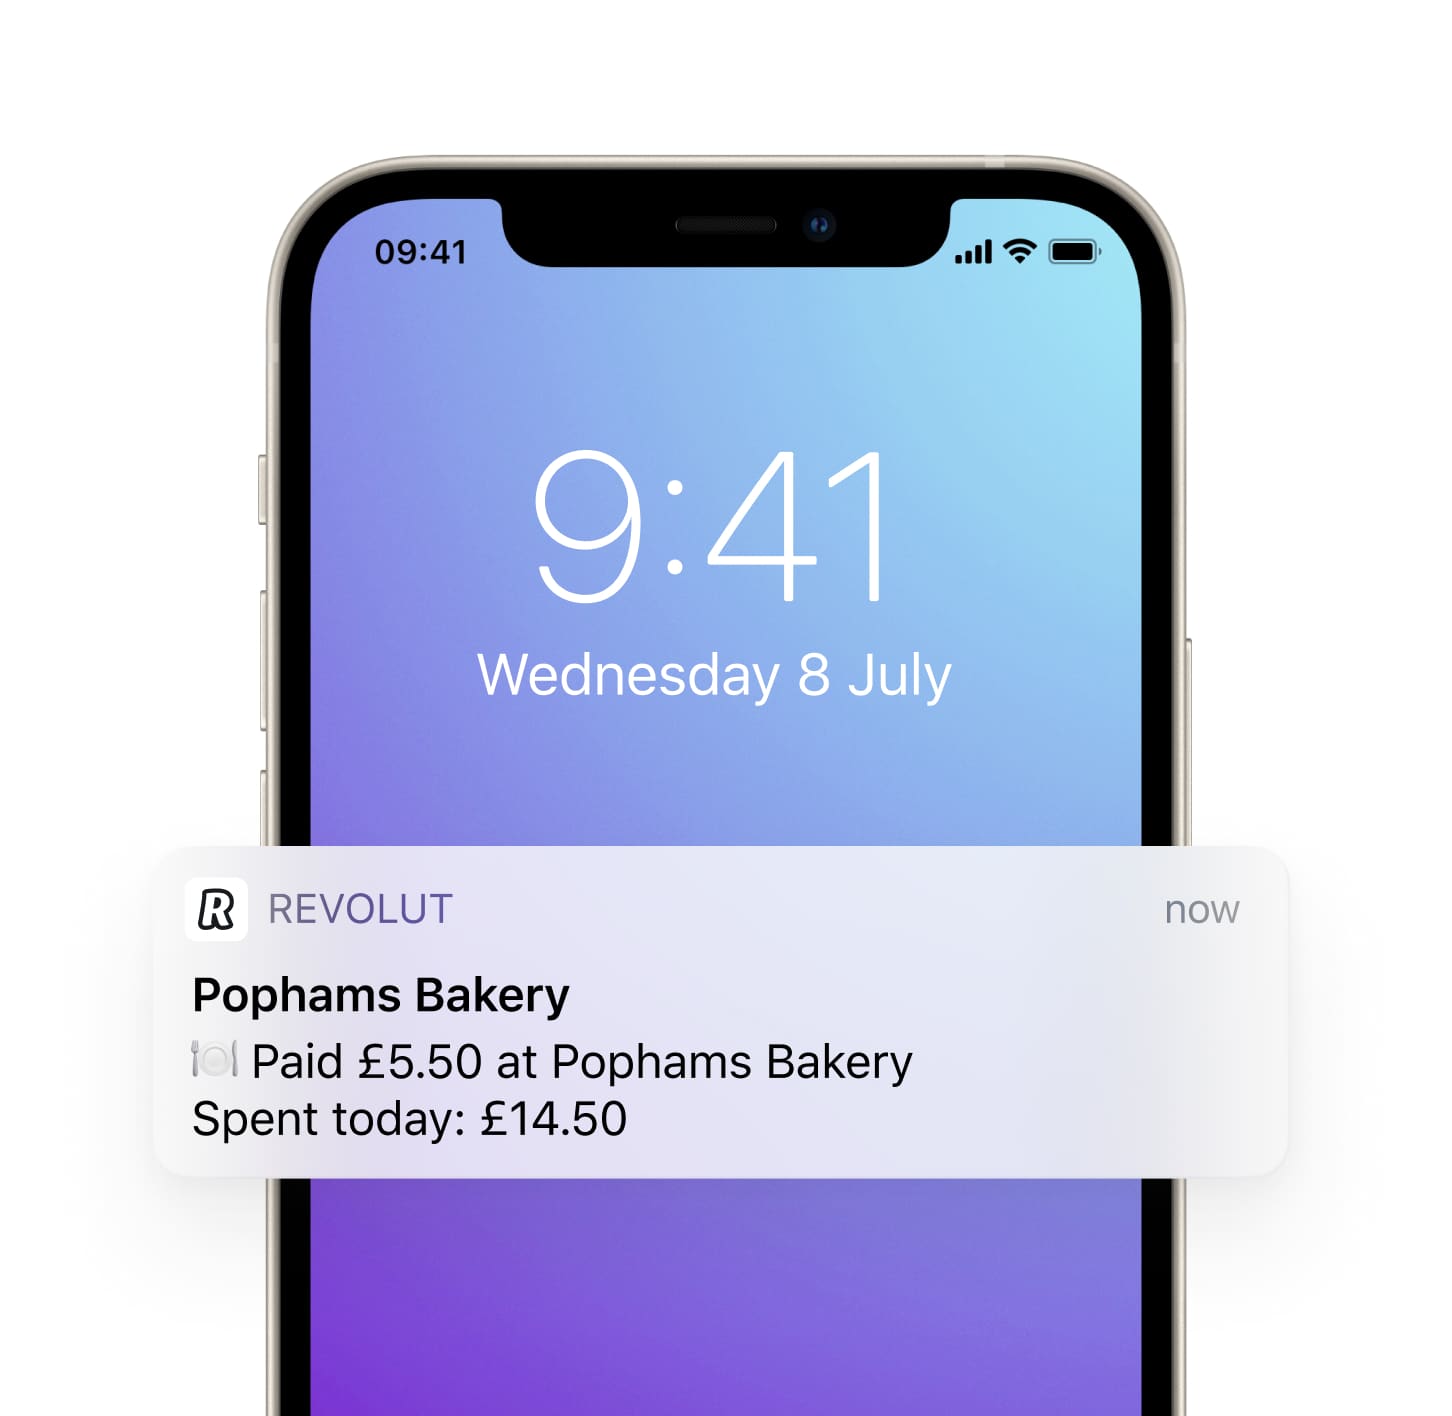
Here’s where it gets interesting. Is a fitness app with an open rate of 30% performing better than a banking app with an open rate of 5%? Your initial answer would probably be a resounding yes. But can you know for sure from just this one piece of data? For the sake of argument, let’s pretend the two apps in question are Fitbit and Revolut. Each app decides to analyze the performance of one particular campaign. The push notifications sent to the user are displayed below.
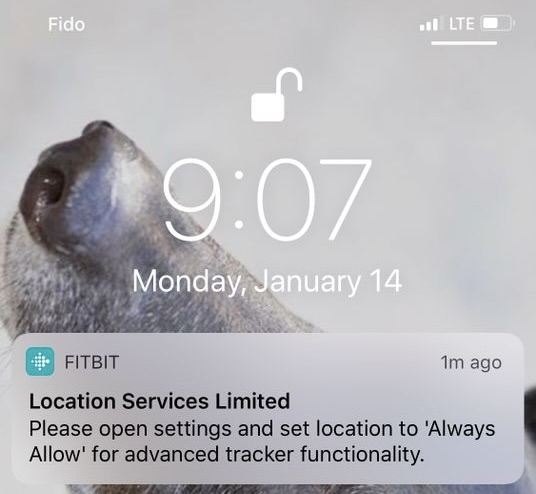
Did you change your mind yet? The notification from Fitbit clearly prompts the user to take action so that they can benefit from the app’s advanced tracker functionality. The incentive is high and enables users to better track their health and fitness. This type of push notification would expect to receive high engagement rates.
On the other hand, Revolut provides valuable and relevant information to their users by notifying them about their daily spend, helping users keep track of their expenditure, and to remain within budget. The key difference here is that users do not need to open, click, or engage with this push notification in order to experience real value from the app. In fact, you might say a high engagement rate would have Revolut asking questions about why users are tapping on this type of message. Glance as engagement is super valid. The job is done in the notification: the less cognitive load or take action requirement on the mobile customer the better.
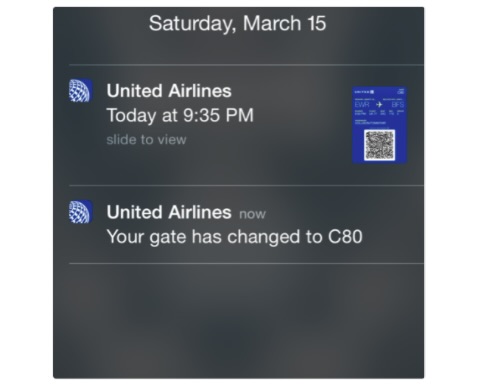
Consider the below example from United Airlines. The first notification requires the passenger to open the push to proceed through security and make their flight. The second conveniently provides all of the information the passenger needs to make their travel as seamless as possible. If instead, the message read “Urgent: Your boarding gate has changed”, it will likely have a very high open rate but this should not be the objective here. Providing all of the information the user needs on screen while they are likely armed with baggage and under time pressure is undoubtedly a much better experience.
Final Thoughts
So, what does all of this teach us about measuring push effectiveness and interpreting the data correctly?
While industry benchmarks are useful as a high-level overview and for making broad comparisons, what’s more important is to understand what your push notifications are trying to achieve. You need to look at the purpose of your unique strategy. For example, if your objective is to provide users with all the information they need within the push and your open rate is high, this is not the desired result. This means users are clicking into the app to understand your message better. If they had all the information within the push, they could simply dismiss the message. So always look at influenced as a metric, not merely opens.
Notification open rates can be suggestive of positive engagement but it’s important to combine metrics to get a clear picture of your performance. Analyzing this with conversions, delivery rates, active users, opt-outs, and uninstalls can provide a more granular view of how push notifications are influencing engagement and retention.
If some of your notifications display the entire message within the push and others aim to drive user action, you will not obtain an accurate picture of what’s working by looking at the open rate unless you break this down by message type or campaign.
It’s essential to gather as much campaign data as possible to understand if the metrics are truly representative of strong app engagement.
Get Started
Want to get started with personalized mobile messaging? Or learn what types of messaging can increase app engagement? We can help. Contact our team anytime.